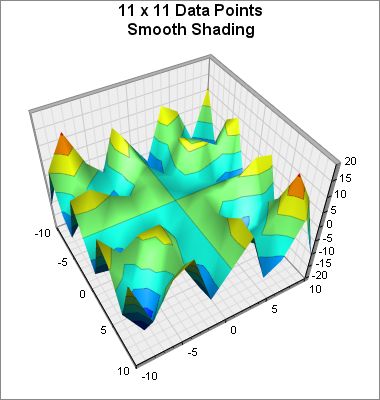
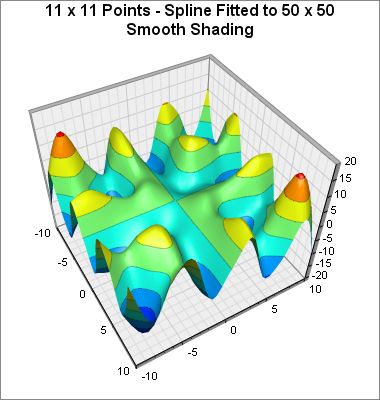
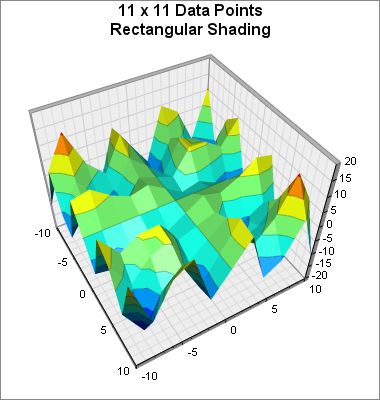
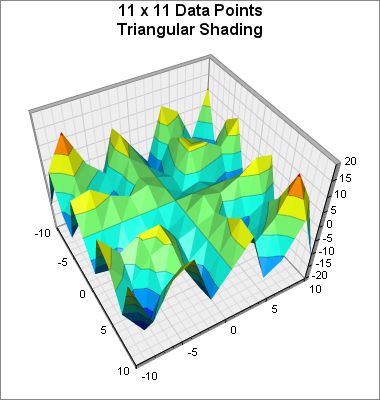
This example demonstrates the effects of various surface shading methods, configured using SurfaceChart.setShadingMode.
ChartDirector Ver 5.0 (Perl Edition)
Surface Shading
Source Code Listing
#!/usr/bin/perl
use perlchartdir;

sub createChart
{
    my $img = shift;

    # The x and y coordinates of the grid
    my $dataX = [-10, -8, -6, -4, -2, 0, 2, 4, 6, 8, 10];
    my $dataY = [-10, -8, -6, -4, -2, 0, 2, 4, 6, 8, 10];

    # The values at the grid points. In this example, we will compute the values
    # using the formula z = x * sin(y) + y * sin(x).
    my $dataZ = [(0) x (scalar(@$dataX) * scalar(@$dataY))];
    for(my $yIndex = 0; $yIndex < scalar(@$dataY); ++$yIndex) {
        my $y = $dataY->[$yIndex];
        for(my $xIndex = 0; $xIndex < scalar(@$dataX); ++$xIndex) {
            my $x = $dataX->[$xIndex];
            $dataZ->[$yIndex * scalar(@$dataX) + $xIndex] = $x * sin($y) + $y * sin(
                $x);
        }
    }

    # Create a SurfaceChart object of size 380 x 400 pixels, with white (ffffff)
    # background and grey (888888) border.
    my $c = new SurfaceChart(380, 400, 0xffffff, 0x888888);

    # Demonstrate various shading methods
    if ($img eq "0") {
        $c->addTitle("11 x 11 Data Points\nSmooth Shading");
    } elsif ($img eq "1") {
        $c->addTitle("11 x 11 Points - Spline Fitted to 50 x 50\nSmooth Shading");
        $c->setInterpolation(50, 50);
    } elsif ($img eq "2") {
        $c->addTitle("11 x 11 Data Points\nRectangular Shading");
        $c->setShadingMode($perlchartdir::RectangularShading);
    } else {
        $c->addTitle("11 x 11 Data Points\nTriangular Shading");
        $c->setShadingMode($perlchartdir::TriangularShading);
    }

    # Set the center of the plot region at (175, 200), and set width x depth x height
    # to 200 x 200 x 160 pixels
    $c->setPlotRegion(175, 200, 200, 200, 160);

    # Set the plot region wall thichness to 5 pixels
    $c->setWallThickness(5);

    # Set the elevation and rotation angles to 45 and 60 degrees
    $c->setViewAngle(45, 60);

    # Set the perspective level to 35
    $c->setPerspective(35);

    # Set the data to use to plot the chart
    $c->setData($dataX, $dataY, $dataZ);

    # Set contour lines to semi-transparent black (c0000000)
    $c->setContourColor(0xc0000000);

    # Output the chart
    $c->makeChart("surfaceshading$img.jpg")
}

createChart(0);
createChart(1);
createChart(2);
createChart(3); |
#!/usr/bin/perl

# Include current script directory in the module path (needed on Microsoft IIS).
# This allows this script to work by copying ChartDirector to the same directory
# as the script (as an alternative to installation in Perl module directory)
use File::Basename;
use lib dirname($0) =~ /(.*)/;

use perlchartdir;

# Get HTTP query parameters
use CGI;
my $query = new CGI;

# The x and y coordinates of the grid
my $dataX = [-10, -8, -6, -4, -2, 0, 2, 4, 6, 8, 10];
my $dataY = [-10, -8, -6, -4, -2, 0, 2, 4, 6, 8, 10];

# The values at the grid points. In this example, we will compute the values using
# the formula z = x * sin(y) + y * sin(x).
my $dataZ = [(0) x (scalar(@$dataX) * scalar(@$dataY))];
for(my $yIndex = 0; $yIndex < scalar(@$dataY); ++$yIndex) {
    my $y = $dataY->[$yIndex];
    for(my $xIndex = 0; $xIndex < scalar(@$dataX); ++$xIndex) {
        my $x = $dataX->[$xIndex];
        $dataZ->[$yIndex * scalar(@$dataX) + $xIndex] = $x * sin($y) + $y * sin($x);
    }
}

# Create a SurfaceChart object of size 380 x 400 pixels, with white (ffffff)
# background and grey (888888) border.
my $c = new SurfaceChart(380, 400, 0xffffff, 0x888888);

# Demonstrate various shading methods
if ($query->param("img") eq "0") {
    $c->addTitle("11 x 11 Data Points\nSmooth Shading");
} elsif ($query->param("img") eq "1") {
    $c->addTitle("11 x 11 Points - Spline Fitted to 50 x 50\nSmooth Shading");
    $c->setInterpolation(50, 50);
} elsif ($query->param("img") eq "2") {
    $c->addTitle("11 x 11 Data Points\nRectangular Shading");
    $c->setShadingMode($perlchartdir::RectangularShading);
} else {
    $c->addTitle("11 x 11 Data Points\nTriangular Shading");
    $c->setShadingMode($perlchartdir::TriangularShading);
}

# Set the center of the plot region at (175, 200), and set width x depth x height to
# 200 x 200 x 160 pixels
$c->setPlotRegion(175, 200, 200, 200, 160);

# Set the plot region wall thichness to 5 pixels
$c->setWallThickness(5);

# Set the elevation and rotation angles to 45 and 60 degrees
$c->setViewAngle(45, 60);

# Set the perspective level to 35
$c->setPerspective(35);

# Set the data to use to plot the chart
$c->setData($dataX, $dataY, $dataZ);

# Set contour lines to semi-transparent black (c0000000)
$c->setContourColor(0xc0000000);

# Output the chart
binmode(STDOUT);
print "Content-type: image/jpeg\n\n";
print $c->makeChart2($perlchartdir::JPG); |